|
|
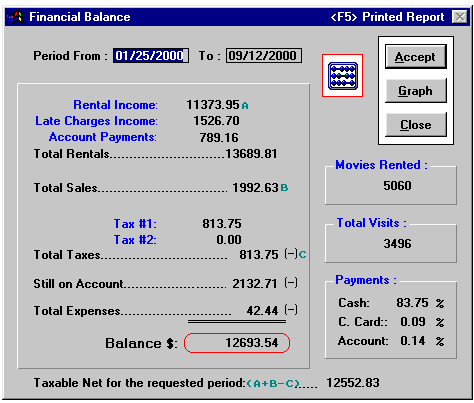
This
report shows the total amount of money and taxes collected
for any period. |
|
|
|
|
|
|
|

|
|
|
|
|
|
|
|
|
|
|
|
|
|
|
|
|
|
|
|
This
report shows the total amount of money and taxes collected
for any period. |
|
|
|
|
|
|
|

|
|
|
|
|
|
|
|
|
|
|
|
|
|
|
|
|
|